Key Performance Practices that Drive Top Quartile Shutdowns, Turnarounds and Outages (STO) Outcomes
Authors: Mike O’Kane, Global Director, and Daniel Phan, Regional Manager, AP-Networks
Introduction
The most expensive, complex projects that operating facilities such as refineries and petrochemical plants regularly undertake are major shutdowns, turnarounds, or outages (commonly referred to as STOs). This article will focus on the key performance practices that drive STO outcomes, and the tools that top STO performers utilize to achieve predictable, competitive outcomes on these capital and resource-intensive events. Being a top quartile performer at both STO preparation as well as execution has a meaningful impact on the company bottom line and the achievement of operational excellence. Indeed, these highly complex events require the contribution and dedication of functions and resources from across the entire site organization.
Key Leading Indicators Driving STO Outcomes
When evaluating and determining what practices drive stronger STO performance outcomes, it is important to recognize that some performance drivers afford more opportunity for the team to influence the outcome than others. For evaluating team control, AP-Networks uses the paradigm shown in Figure 1.
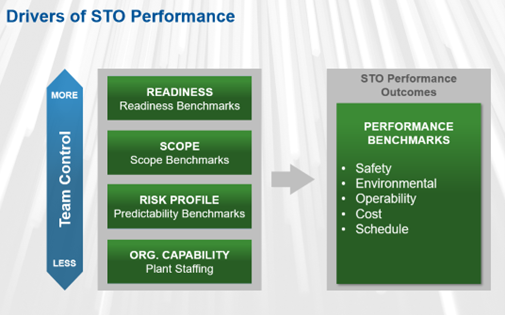
AP-Network’s data shows that STO performance outcomes in terms of safety, cost, schedule, and operability are not random. Rather, the outcomes are predictable during the planning and preparation phases, prior to execution when the right measures are used. Leading indicators- such as the level of scope definition and completeness of planning, the event’s inherent risk characteristics, have a quantifiable effect on STO outcomes, as shown in Figure 1. There are varying degrees, however, to which these leading indicators are controllable. In this paper we will discuss what are these controllable and uncontrollable factors, and how we can use analytical predictive tools to understand their effects on STO outcomes.
1) Uncontrollable Leading Indicators: Organizational Capability
Let us first look at the factors that most STO Teams have little or no control over with; the category that provides the team with the least control are Organizational Capability. This is because the size of the plant is a direct factor of the total number of staffs working on the plant and is outside the control of the STO team. The key elements of organizational capability are: Leadership, Shared Mindset, Management Practices, Capacity for Change and Resources – Numbers and Competencies. In this paper, we will discuss on the Resources, i.e., plant staffing.
For the top performers, STOs are a site priority and multiple disciplines are required to work together for success. Without proper resources, it is impossible to achieve best-in-class outcomes. To achieve a high state of readiness, it is vital that STO teams have the right people in place to successfully prepare for their event.
AP-Networks are able to leverage our STO database – the largest collection of planned and actual event data in the world spanning 2,500+ observations from Industry – to evaluate the size of the upcoming events against the site’s ability to effectively plan for those events. In other words, our Site Capability Analysis is able to indicate whether the workload associated with STO event preparations will exceed the site’s organizational capabilities during the planning and execution cycle.
The industry data shows a clear association between number of plant staffing levels and likely turnaround overruns. By evaluating and analyzing the number of plant personnel on site, we can determine whether the site has the capacity to plan and execute a large complexity STO effectively and identify the “critical zone” that drives cost and schedule overruns.
2) Uncontrollable Leading Indicators: STO Inherent Risks
Another factor in the category that provides the team with little control are the many of the factors that contribute to the event’s inherent risk profile or characteristics. A few examples of inherent risks the team may have little to no ability to influence include:
- The volume of capital project work that must be integrated into the STO event
- Characteristics of the site plot plan such as congestion in work areas
- Skilled craftworker and resource availability in the region
Although the level of control that the STO organization has over these characteristics is very limited – such as qualified labor availability, material condition of the plant, equipment congestion, etc. – the examination and understanding of these inherent risks enables the quantification of their effect on STO outcomes. This in turn provides us with a gauge of the likelihood of meeting STO targets.
So how do we go about quantifying these STO risk characteristics?
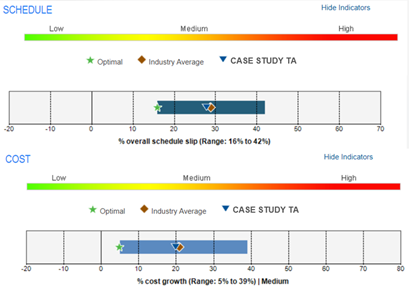
The inherent risks can be modeled using the AP-Networks Industry data-driven Risk Manager tool, which analyzes the inherent risks to any given STO event and provides the typical range of outcomes for industry STOs with the same characteristics, as shown in Figure 2. With the range of typical industry outcomes identified, the quantified readiness can be used to provide a specific, probabilistic outcome scenario based on actual industry STO readiness and outcome data, as well as the likely outcome scenario if readiness is improved to an optimal level. We will come back to the topic of readiness shortly.
3) Semi-Uncontrollable Leading Indicators: STO Scope
Going back to Figure 1, the second category, Scope, does provide the team with some moderate level of influence and in many cases, there is some ability to move particular work scope activity or equipment to routine maintenance that can be executed during normal operation. There is also team influence on the effectiveness of scope challenge and scope freeze by employing strong control and discipline. However, there is always some scope that must be executed, which is recognized as a key driver of the STO event itself.
Getting the work scope right is essential to STO performance, since scope serves as the foundation for cost, schedule, and plant reliability. Minimizing the amount of scope and the level of scope growth during the STO execution window is the primary driver of competitiveness. It also takes strong commitment from leadership and the preparation team for the prevention of unnecessary change to the scope.
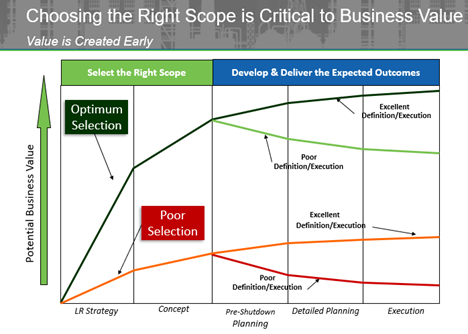
As seen from Figure 3 above, choosing the “Right Scope” is critical to business value, as value is created in the early phases of a STO, through scope selection. Optimum selection of scope early on, coupled with excellent Definition / Execution, can have significant impact on execution efficiency and the STO performance outcome. In contrast, bad decisions or preparation gaps early on, can have a significant impact on the outcome. If scope selection is not optimum, unnecessary work will be performed having a negative impact on the outcome event if the team demonstrates excellent definition and execution. Therefore, making the right decision on scoping early on can have a huge effect on the eventual outcome.
One practice used by Industry to optimize scope is to conduct a Risk Based Scope Review (RBSR). RBSR is a fact-based, logical approach to scope evaluation and that provides the team with a structured approach to scope decision making. RBSR has several benefits. An effective RBSR workshop will help the team to: 1) define optimal STO scope using historical data and fact-based methods, 2) improve startup and run time reliability and 3) gain buy-in to the final STO scope from all departments.
RBSRs require historical reliability and integrity data to determine specific equipment and asset risks, and all major scope stakeholders must contribute to the analysis. Some facilities or organizations may not have access to robust historical data required to perform an RBSR. Another valuable practice is Turnaround Scope Indexing which allows a STO to benchmark its specific scope to Industry for similar STOs and for the same process unit types.
Using its broad STO database, several years ago AP-Networks began offering a new scope benchmarking methodology. The Turnaround Scope Index (TSI), as shown in Figure 4, is now used by many Industry leaders at several points during the planning process to ensure that scope selection is competitive with peers and does not include what may be unnecessary work.
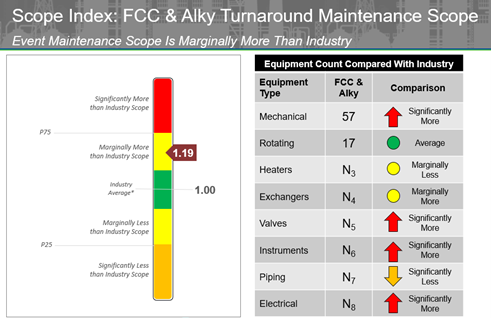
The TSI fills a long-standing knowledge gap and puts a powerful new type of analysis in the hands of Industry that has never before been available. With the TSI, AP-Networks has provided industry with the ability to benchmark process unit specific STO scope relative to Industry norms. As mentioned, organizations can substantially improve STO performance and realize cost savings through scope optimization, and TSI benchmarking helps STO teams empirically and quantitatively demonstrate these savings relative to their Industry peers through benchmarking STO scope, labor hours, costs, and schedule relative to Industry.
4) Controllable Leading Indicators: Readiness
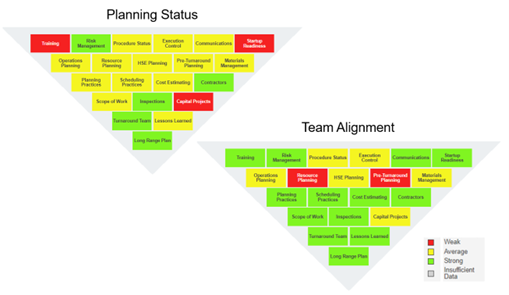
Although each STO event is characterized by a set of inherent, uncontrollable factors that affect its outcome, the preparation team must regularly deal with a myriad of factors that are controllable and have a profound impact on the event’s predictability and competitiveness. AP-Networks has defined 21 areas that are critical to the upfront preparation for a STO, collectively known as Readiness as shown in Figure 5.
Readiness is the category that provides the team with the most influence, and it consists of the plan and particular activities the team utilizes to prepare for the event. The quality of the team’s planning and preparation is generally within their own control. Figure 1 shows that scope definition and planning practices are not only well within the control of the STO organization, but they are also leading indicators of STO success. In other words, the STO team has control over how they go about planning and preparing for their STO.
So how can the state of readiness of a STO team be quantified and measured to ensure it is optimal?
With this question in mind, AP-Networks developed the previously mentioned Turnaround Readiness Index (TRI). It consists of two primary components: planning status and team alignment and is measured by application of AP-Networks’ Turnaround Readiness Pyramid Tool, which measures the current state of preparation across the 21 areas that are critical to the upfront preparation for a STO. These areas can be broadly categorized as strategic, tactical, or execution in nature. The tool provides a real-time measure of planning status, team alignment, and the TRI as shown in Figure 5.
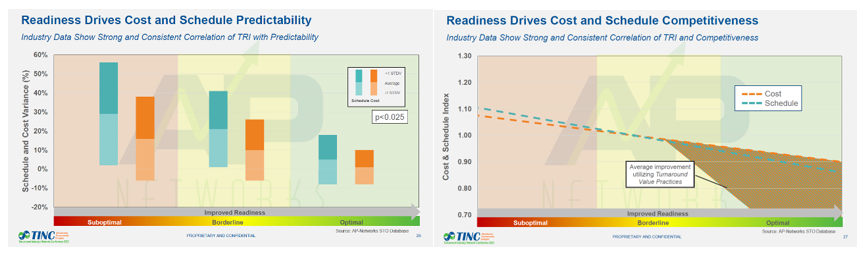
With more than 20 years of application, the TRI measure has been proven to be a strong predictor of STO performance outcome. Higher TRI scores lead to both improved outcome predictability as well as improved competitiveness relative to industry, and this has been proven across thousands of STO events as shown in Figure 6.
Key Takeaways
AP-Network’s data shows that STO performance outcomes are not random. Leading indicators, such as the level of scope definition and completeness of planning, the event’s inherent risk characteristics, the scope to be executed, have a quantifiable effect on STO outcomes. There are varying degrees to which these leading indicators are controllable. By using the right measures and tools, top performers are able to predict STO outcomes during the planning and preparation phases, prior to execution.
In addition, by early selection and planning the “Right Scope”, coupled with excellent Definition / Execution, these top performers are able to achieve STO competitiveness and create high business value for their organization. Lastly, effective implementation of best practices requires a collaborative and capable site organization. This risk can be partially evaluated using AP-Network’s Site Capability curve to evaluate the size of the upcoming events against the site’s ability to effectively plan for those events.
This document is confidential and contains proprietary information. It shall not be copied or shared with any individual or entity, other than that to whom it is intended, without the written consent of Asset Performance Networks, Asia Pacific Pte. Ltd.
About the Authors
Mike O’Kane is the Global Director for Asset Performance Networks, based out of the company’s office in Houston, Texas. His experience encompasses more than two decades in the refining and power industries, as well as work in process improvement and business performance consulting. In his current role, Mike shares responsibility for the development and ongoing improvement of the company’s products and services, encompassing software, benchmarking, and consulting solutions.
Daniel Phan is currently a Regional Manager with Asset Performance Networks Asia Pacific Pte Ltd in Singapore. He has more than 20 years of experience in plant STO and project management consultancy in the oil & gas, petrochemical, maritime industries.
AP-Networks is the trusted leader for improving asset and operational performance in petroleum, chemical, mining, agricultural and other manufacturing companies worldwide. AP-Networks works with the client’s most critical assets—their people, processes, and production facilities—in order to help them achieve safe, competitive, predictable outcomes on their high-risk events—namely capital projects and STO.
Contact: mokane@ap-networks.com / dphan@ap-networks.com